

Abstract
Objective: Thymus size and density progressively decrease through adulthood on CT. Many factors may influence thymic involution, resulting in varying CT appearances. This study aimed to evaluate thymic involution in adults using a detailed quantitative CT analysis—including volumetric soft-tissue segmentation and density measurements—and to investigate its associations with age, sex, and smoking.
Materials and Methods: Adults aged 18-50 years without known systemic disease, who underwent chest CT between June 2020 and October 2025 were retrospectively reviewed. Visual thymic scoring (0-3) and quantitative CT measurements—transverse and anterior-posterior diameters, right and left lobe lengths, overall thymus area, soft tissue area, and attenuation—were performed. These parameters were compared among thymic score groups, also based on sex and smoking status. Thymic scores were dichotomized into advanced (>50% fatty replacement, scores 0-1) and mild (≤50%, scores 2-3) groups. Logistic regression analysis was performed to identify independent predictors of advanced fatty replacement.
Results: A total of 136 patients (mean age 35.5±9, 48.5% male) were included. Age and sex significantly differed across thymic score groups (p<0.001 and p=0.018, respectively). Transverse diameter, CT attenuation, and soft tissue area increased with higher thymic scores (all p<0.05), although other diameters were not significantly different between score groups. Males exhibited significantly lower thymic scores and CT attenuation despite higher thymus diameters and area (p<0.05). Age and male sex were independently associated with advanced fatty replacement (p<0.05). Smoking was not an independent predictor despite negative correlations with thymic score, CT attenuation, and soft tissue area.
Conclusion: Thymic involution in adults is heterogeneous and primarily driven by age and sex. Fatty replacement predominates over size reduction, and males are more likely to exhibit advanced involution.
Keywords: thymus, chest, multidetector computed tomography
Introduction
The thymus is a lymphoid organ located in the anterior mediastinum, responsible for T-cell development. Physiologically, the thymus reaches its maximum size in puberty, followed by a gradual involution with increasing age. The epithelial component regresses, and fatty replacement occurs [1-3]. Correspondingly, on computed tomography (CT), the thymus appears as a homogeneous soft-tissue structure, with thymic size and density progressively decreasing through adulthood. This involution process varies among individuals, resulting in different appearances and stages of thymic involution in CT even within the same age group [3-7]. Awareness of these differences and age-related changes in thymic size and density is important for distinguishing a normal thymus from thymic hyperplasia or thymic masses.
Physiological thymic involution is responsible for functional impairment of T-cell-mediated immunity and was associated with age-related immunologic decline, also known as “immunosenescence”. Since aging and impaired immune function are associated with an increased incidence of infections and malignancies, the factors affecting, especially accelerating thymic involution, are important [8,9].
Previous studies have reported that age, sex, smoking, and body mass index are associated with the degree of thymic fatty involution on CT [3,4,10].
In this study, we aimed to evaluate thymic involution in adults using a detailed quantitative CT analysis in addition to visual assessment—including volumetric soft-tissue segmentation and density measurements—and to investigate its associations with age, sex, and smoking.
Material and Methods
Study population
Our institutional review board approved the study (SBA 25/987, approval number: 2025/22-36). Patients who underwent chest CT between June 2020 and October 2025 were retrospectively reviewed from our institutional database. Patients who met the following inclusion criteria were included in the study: patients (i) between 18 and 50 years of age, (ii) without a known systemic, oncologic, or immunological disease, (iii) without a known history of thoracic or mediastinal surgery, and (iv) with available data regarding smoking history.
Exclusion criteria were as follows: patients (i) younger than 18 or older than 50 years of age, (ii) with a known malignancy or systemic disease, (iii) with a history of chemotherapy, immunotherapy, radiotherapy, bone marrow transplantation or high-dose steroid treatment, (iv) with a history of thymic mass or evidence of a thymic mass on current CT, (v) who underwent thoracic or mediastinal surgery, (vi) with unavailable smoking data, and (vii) with poor-quality CT scans due to artifacts.
Patient characteristics such as age, sex, smoking status, and cumulative smoking amount (pack-years) were retrospectively retrieved from electronic medical records.
CT protocol
All patients underwent chest CT in the supine position, after intravenous contrast administration, during breath-hold at the end of inspiration. CT scans were obtained using multidetector CT scanners (Somatom Force and Somatom Perspective, Siemens Healthineers, Erlangen, Germany; and Optima CT 540, GE Healthcare, Chicago, IL, USA). Scanning parameters were as follows: tube voltage 100-120 kV, tube current 100-300 mAs (depending on patient size), matrix 512×512, field of view 350×350 mm, and slice thickness between 3 and 5 mm. Images were reconstructed using iterative reconstruction with a slice thickness between 1 and 1.5 mm and a soft-tissue kernel.
CT evaluation
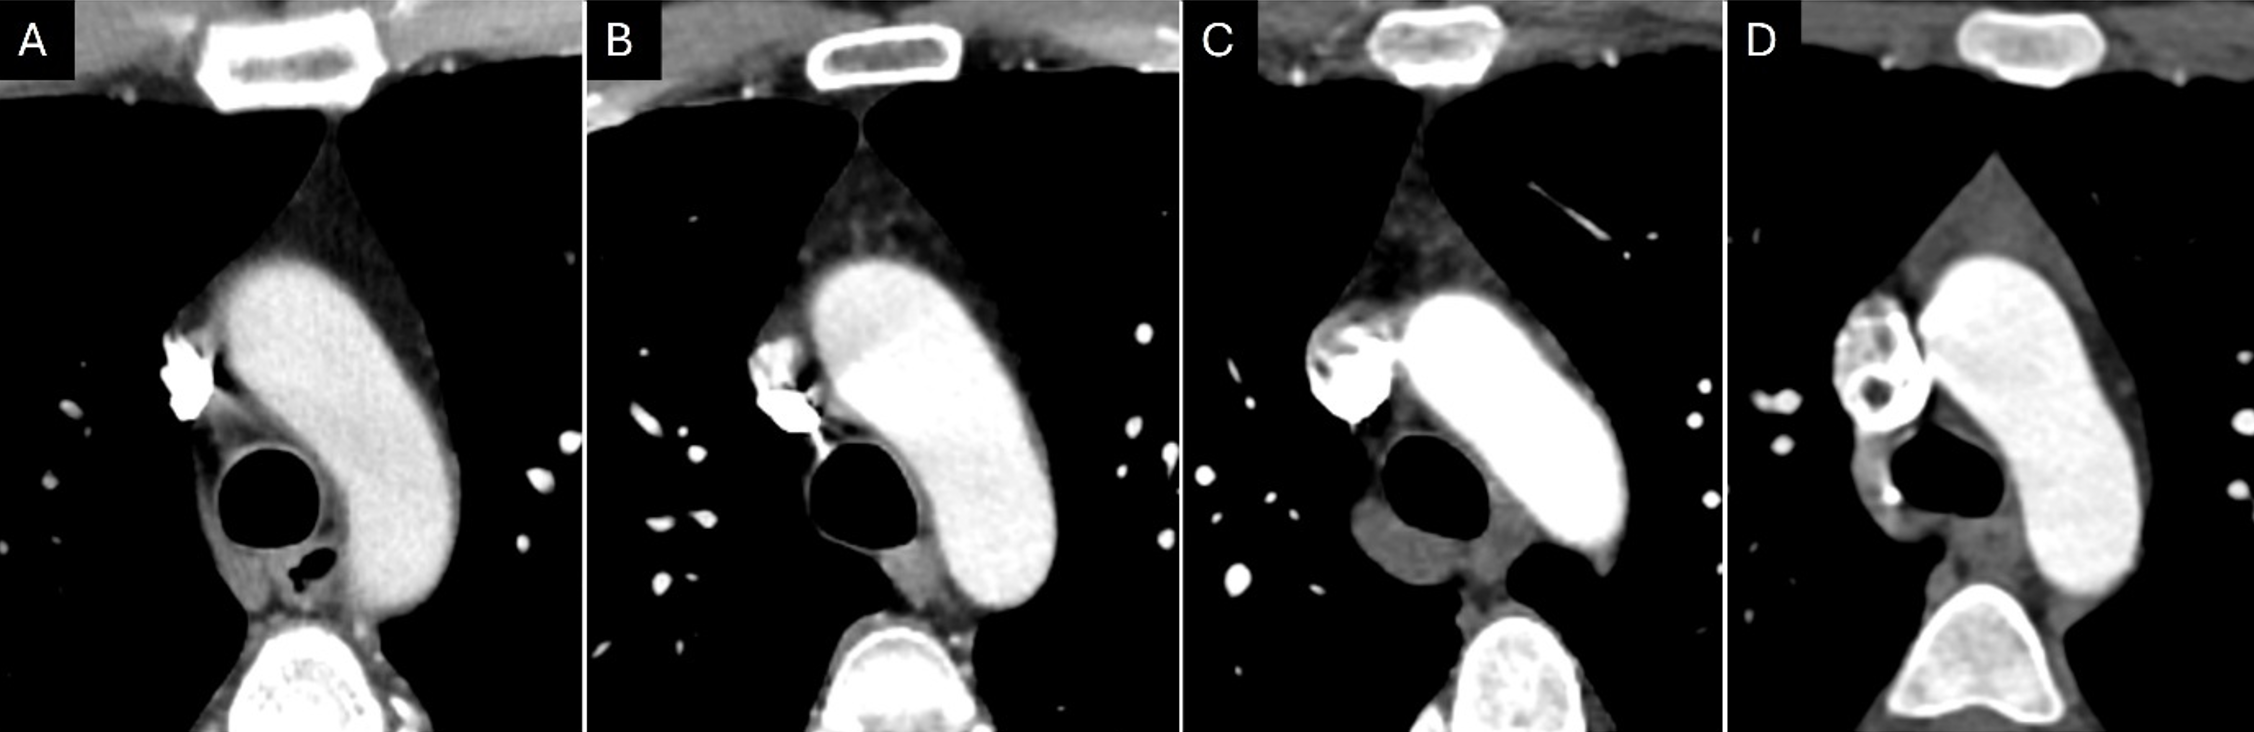
CT images in mediastinal window settings (WW=350 HU, WL=50 HU) were analyzed by two thoracic radiologists with 6 and 10 years of experience using a dedicated workstation (MM Reading, syngo.via version VB60S_HF03, Siemens Healthineers, Erlangen, Germany). First, visual thymic scoring was performed as follows: score 0, complete fatty replacement; score 1, predominantly fatty tissue; score 2, approximately half of the thymic gland is composed of fatty tissue and half soft tissue; score 3, predominantly soft tissue [4] (Figure 1).
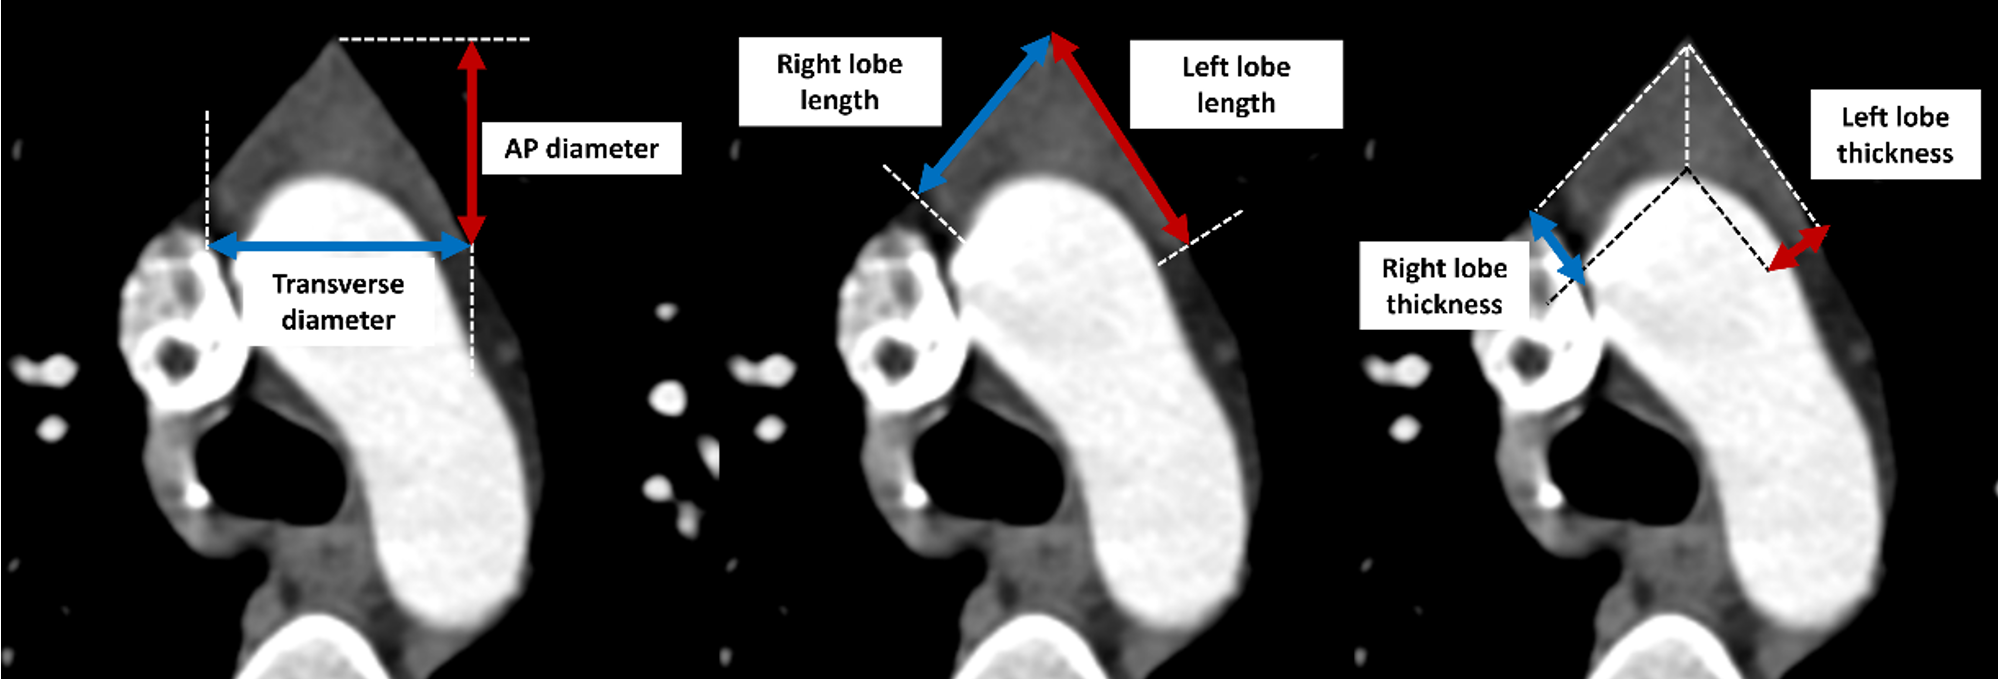
Following visual scoring, CT-based thymic measurements were performed in thymic score groups 1, 2, and 3. Patients with a thymic score of 0 were excluded from quantitative CT measurements due to complete fatty replacement. The axial slice demonstrating the largest thymic area was identified. Using this slice, the transverse diameter, anterior-posterior (AP) diameter, length, and thickness of the right and left thymic lobes were measured as described previously [3] (Figure 2).
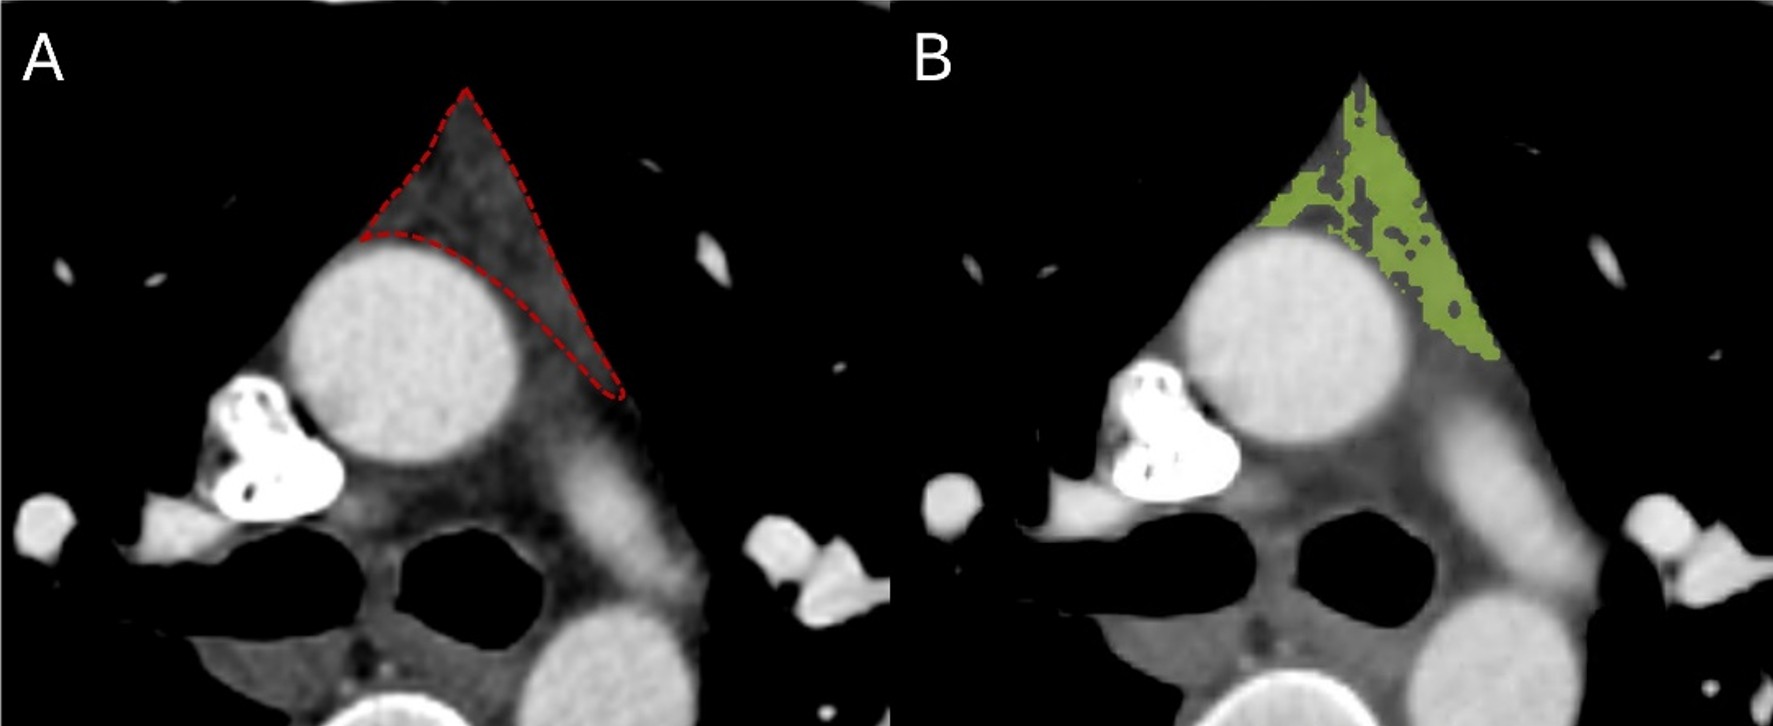
The maximum area and mean attenuation (Hounsfield unit- HU) of the thymus were measured using a region-of-interest (ROI), avoiding mediastinal fat tissue. Semiautomatic volumetric segmentation of thymic soft tissue (restricted to soft tissue CT attenuation, between -50 HU and 150 HU) was performed using the “Region growing” tool (syngo.via version VB60S_HF03, Siemens Healthineers, Erlangen, Germany). Subsequently, the thymic soft-tissue area was derived from volumetric data using the following formula: volume (cm3)/ [slice thickness (mm) /10] (Figure 3). Also, the soft tissue-to-overall thymus area ratio was calculated by dividing the thymic soft tissue area by the overall thymus area.
Statistical analysis
Normality of the data distribution was evaluated using the Shapiro-Wilk and Kolmogorov-Smirnov tests. Continuous variables were presented as mean ± standard deviation (SD) for normally distributed data, and as median (interquartile range) for non-normally distributed data. Categorical variables were presented as frequencies (percentages) and compared using the Pearson chi-square test.
For comparisons of continuous variables among different thymic score groups, one-way analysis of variance (ANOVA) was used for normally distributed data, while the Kruskal-Wallis test was used for non-normally distributed data. Post-hoc pairwise comparisons were conducted using Tukey’s HSD following ANOVA, and Dunn’s test with Bonferroni correction following the Kruskal-Wallis test. For numerical variables that show a normal distribution but have non-homogeneous variances, the Welch ANOVA test was used, and for variables showing differences after the test, the Tamhane post hoc test was used. To compare differences based on smoking status and sex groups, the Mann-Whitney U test was used.
Thymic scores were dichotomized into two groups based on the degree of fatty replacement: advanced fatty replacement (>50%, scores 0- 1), and mild fatty replacement (≤50%, scores 2-3). Logistic regression was used to investigate the predictors of advanced fatty replacement.
All analyses were performed using IBM SPSS Statistics 23.0 software. A p-value < 0.05 was considered statistically significant.
Results
A total of 136 patients (mean age 35.5±9, 48.5% male) were included in the study. The most common CT indications were chest pain (n=36, 26.5%), dyspnea (n=17, 12.5%), suspected X-ray abnormality (n=17, 12.5%), trauma (n=16, 11.8%), screening due to smoking history (n=15, 11%), donor evaluation (n=13, 9.6%), cough (n=12, 8.8%), screening for malignancy (n=6, 4.4%) and fever (n=4, 2.9%).
Patients were grouped according to thymic scores as follows: score 0 (n=14, 10.3%), score 1 (n=37, 27.2%), score 2 (n=37, 27.2%), and score 3 (n=48, 35.3%). Age and sex were significantly different between the thymic score groups (p<0.001 and p=0.018, respectively). Higher thymic scores were observed in younger patients; in contrast, lower thymic scores, corresponding to advanced fatty replacement, were associated with older age. While 69.8% of patients aged 18-30 years had a thymic score of 3, this ratio was 13% among those aged 41-50 years (Table 1).
| Continuous data were presented with mean±SD or median (interquartile range), and categorical data were expressed as frequency (percentage). Differences between groups were analysed using: a One-way ANOVA (post-hoc comparison was performed using Tukey’s HSD test), b Pearson chi-square test, c Kruskal-Wallis test (post-hoc comparisons were performed using Dunn’s test with Bonferroni correction). | ||||||
| Table 1. Patient characteristics according to thymic score groups. | ||||||
|
|
(n=37) |
(n=37) |
(n=48) |
|
|
|
| Age |
|
|
|
|
|
|
| Age groups | ||||||
| 18-30 (n=43) |
|
|
|
|
||
| 31-40 (n=47) |
|
|
|
|
||
| 41-50 (n=46) |
|
|
|
|
||
| Sex |
|
|
|
|
|
|
| Female (n=66) |
|
|
|
|
|
|
| Male (n=70) |
|
|
|
|
||
| Smoking | ||||||
| Present (n=76) |
|
|
|
|
|
|
| Absent (n=60) |
|
|
|
|
||
|
Cumulative smoking (pack-years) |
|
|
|
|
|
|
The most common thymic scores among female and male patients were score 3 (n=31, 47%) and score 1 (n=22, 31.4%), respectively. Most patients with a score of 0 were male (n=11, 78.6%), while the majority of those with a score of 3 were female (n=31, 64.6%). Also, score 0 was the least observed thymic score among females (n=3, 4.5%) (Table 1).
Fifty-six percent of the patients had a smoking history (n=76). The majority of patients with a thymic score of 0 (n=9, 64.3%) had a smoking history, whereas more than half of the patients with a score of 3 had no smoking history (n=27, 56.3%). Although smoking status was not significantly different between groups, among non-smokers, score 3 was the most frequent thymic score (n=27, 45%). Cumulative smoking exposure was significantly different between groups. Notably, the median exposure was significantly lower in patients with a thymic score of 3 compared to those with scores of 0, 1, and 2 (0 vs 13.5, 7.5, and 7 pack-years, respectively; p<0.05) (Table 1).
The transverse diameter of the thymus was significantly larger in the score 3 group (p=0.027). However, AP diameter, length, and thickness of right and left lobes, and overall thymus area did not show any significant difference between thymic score groups (all p>0.05). A statistically significant increase in thymic CT attenuation (HU) was observed with increasing thymic scores (p<0.001). Also, the thymic soft tissue area and soft tissue-to-overall thymus area ratio increased significantly from score 1 to score 3 (p<0.001) (Table 2).
| Continuous data were presented with mean±SD or median (interquartile range). Quantitative assessments were not applicable for patients with a thymic score of 0. Differences between groups were analysed using: a One-way ANOVA, b Kruskal-Wallis test. Post-hoc comparisons were performed using Dunn’s test with Bonferroni correction, c Welch ANOVA, Tamhane was used as a post-hoc test. | |||||
| Table 2. CT- derived thymus measurements according to thymic score groups. | |||||
|
|
|
|
|
|
|
| Transverse diameter (mm) |
|
|
|
|
|
| Anterior-posterior diameter (mm) |
|
|
|
|
|
| Right lobe length (mm) |
|
|
|
|
|
| Right lobe thickness (mm) |
|
|
|
|
|
| Left lobe length (mm) |
|
|
|
|
|
| Left lobe thickness (mm) |
|
|
|
|
|
| CT attenuation (HU) |
|
|
|
|
|
| Overall thymus area (cm2) |
|
|
|
|
|
| Soft tissue area (cm2) |
|
|
|
|
|
| Soft tissue/ overall thymus area ratio |
|
|
|
|
|
No significant differences were found based on smoking presence for either the thymic score or all other CT-derived parameters (all p>0.05). However, transverse and AP diameters, lobe lengths and thicknesses, and overall thymus area were significantly different between females and males (all p<0.05). The thymic score, density, and soft tissue-to-overall thymus area ratio were significantly lower in male patients (p<0.05) (Table 3).
| Continuous data were presented with median (interquartile range). Quantitative assessments were not applicable for patients with a thymic score of 0. Differences between groups were analysed using the Mann-Whitney U test. | |||
| Table 3. CT- derived thymus measurements according to sex. | |||
|
(n=63) |
(n=59) |
|
|
| Age |
|
|
|
| Cumulative smoking (pack-year) |
|
|
|
| Thymic score |
|
|
|
| Transverse diameter (mm) |
|
|
|
| Anterior-posterior diameter (mm) |
|
|
|
| Right lobe length (mm) |
|
|
|
| Right lobe thickness (mm) |
|
|
|
| Left lobe length (mm) |
|
|
|
| Left lobe thickness (mm) |
|
|
|
| CT attenuation (HU) |
|
|
|
| Overall thymus area (cm2) |
|
|
|
| Soft tissue area (cm2) |
|
|
|
| Soft tissue/ overall thymus area ratio |
|
|
|
There was a strong negative correlation between age and thymic score (r= -0.609, p<0.001). In contrast, the thymic score exhibited very strong positive correlations with both CT attenuation (r=0.904, p<0.001) and soft tissue area (r=0.834, p<0.001).
Age showed a weak positive correlation with cumulative smoking amount (r=0.237, p=0.007), a strong negative correlation with thymic CT attenuation (r=-0.638, p<0.001), and a moderate negative correlation with thymic soft tissue area (r=-0.568, p<0.001). Cumulative smoking amount had weak negative correlations with thymic score (r=-0.297, p=0.001), thymic CT attenuation (r=-0.287, p=0.002), and soft tissue area (r=-0.219, p=0.019).
Thymic scores were dichotomized into two groups based on the degree of fatty replacement: advanced fatty replacement (>50%, scores 0- 1), and mild fatty replacement (≤50%, scores 2-3). Logistic regression model to predict the dichotomized thymic score groups was statistically significant (X² (3)= 62.782, p<0.001, NagelkerkeR²=0.504). Age (OR=1.23, 95%CI:1.14-1.32, p<0.001) and male sex (OR=4.52, 95%CI: 1.69-12.08, p=0.003) were independent factors related to advanced fatty replacement. Each one-year increase in age was associated with a 1.23-fold and male sex was associated with a 4.52-fold higher odds of advanced fatty replacement. Smoking status had no statistically significant effect (p=0.305).
Discussion
The main findings of our study show that thymic involution is primarily driven by age and sex. Male patients had significantly lower thymic scores and CT attenuation, corresponding to increased fatty replacement. While lower thymic scores were strongly correlated with lower CT attenuation and soft tissue area, most size-related parameters remained similar across score groups, suggesting that fatty replacement rather than true size reduction predominates during thymic involution. Although the cumulative smoking amount differed significantly between thymic score groups and showed negative correlations with thymic score, soft tissue area, and density, logistic regression analysis demonstrated that smoking was not an independent predictor of advanced fatty replacement.
Age was significantly different between thymic score groups, and exhibited negative correlations with thymic score, CT attenuation, and thymic soft tissue area, consistent with the literature [3-6]. Naik et al. reported the mean age of complete fatty replacement as 45.4 ± 12.9 years [6]. Simanovsky et al. reported that 71% of participants with a mean age of 52.6 (14-78 years) demonstrated complete fatty replacement. In addition, no solid tissue component was observed after 54 years of age [5]. In our study, among individuals between 41 and 50 years of age, the incidence of thymic scores 0 and 1 was 21.7% and 47.8%, respectively. On the other hand, in the study of Araki et al., which included patients in a wide age range (34-92 years), 9% of participants older than 60 years exhibited a thymic soft tissue component [3]. Moreover, in another study of individuals between 60-69 years of age, residual thymic tissue incidence was reported as 34.8% [7]. These findings reflect the variability of the thymic involution process within the population.
In our study, the transverse diameter of the thymus was significantly larger in patients with a thymic score of 3 (p=0.027), with significantly higher CT attenuation, soft tissue area, and soft tissue-to-overall thymus area ratio (p<0.001). In contrast, AP diameters, lengths, and thicknesses of both thymic lobes and total thymic area were not significantly different between thymic score groups. Similarly, Araki et al. found no significant correlation between thymic size and age, apart from AP diameter and right lobe length in females [3]. This may reflect that thymic size does not substantially decrease, but rather undergoes fatty replacement [11,12]. Additionally, in our study thymic score exhibited very strong positive correlations with both CT attenuation (r=0.904, p<0.001) and soft tissue area (r=0.834, p<0.001), with lower thymic scores corresponding to lower CT attenuation values. Therefore, it may be speculated that visual thymic scoring better reflects the degree of involution.
Male patients had significantly lower thymic scores, CT attenuation, and soft tissue-to-overall thymus area ratio compared to females, despite having significantly larger thymic size in the present study. Similarly, Ackman et al. reported that in adults aged 20-30 years, fatty involution occurs earlier and more rapidly in male patients, although the AP diameter was significantly larger [4]. In Sandstedt et al.’s study, the majority of patients with a thymic score of 0 (64%) were male; this ratio was higher in our study (78.6%)[10]. Also, 64.6% of patients with a thymic score of 3 were female in our cohort. By comparison, this ratio was reported as 85% by Sandstedt et al. and 86% by Araki et al. [3,10]. Our logistic regression analysis revealed that males were 4.5 times more likely to exhibit advanced fatty replacement compared to females (95%CI: 1.69-12.08, p=0.003). This difference may be explained by the fact that sex steroids play an important role in thymic involution, in which androgens may have a greater influence [13]. On the other hand, females also experience a temporary thymic involution during pregnancy due to increased levels of sex steroids, primarily progesterone. This is thought to be an adaptive immune response to prevent fetal rejection and maintain normal pregnancy [14,15].
Thymic involution leads to an impaired immune function and a decrease in naive T‐cell production [8,9]. Sex-based differences in immunity have been reported to be more marked in the elderly, with males exhibiting a greater decrease in naive T cell activity compared to females [16]. It may be speculated that the more pronounced immunological decline in males may be related to the greater degree of thymic involution. Similarly, Sandstedt et al. found that age, male sex, and obesity were associated with complete fatty replacement of the thymus. Furthermore, low CT attenuation values were related to lower thymic activity and depletion of naive T-cells. Therefore, they stated that CT may be valuable in assessing immunological aging [10].
Smoking’s effect on thymic involution may be associated with the immunosuppressive effects of tobacco exposure and the systemic oxidative stress it induces. Sandhar et al. reported that thymic output was influenced by sex and smoking, based on their analyses of blood T cell populations and the presence of thymic tissue in mediastinal fat tissue using flow cytometry in patients undergoing cardiothoracic surgery [17]. In the present study, although the majority of patients with a thymic score of 0 (64.3%) had a smoking history, smoking status was not significantly different between thymic score groups and was not an independent predictor of thymic involution. On the contrary, Araki et al. observed a significant association between smoking and advanced fatty replacement. They reported that 64% of patients with a score of 3 were non-smokers, whereas patients with a score of 0 were more commonly smokers with high pack-year exposure (49%) [3]. Likewise, we observed that cumulative smoking amount was negatively correlated with thymic score, thymic CT attenuation, and soft tissue area (p<0.05). The median smoking exposure was highest in patients with a thymic score of 0 and significantly lower in those with a score of 3 (p<0.05). Despite this, the lack of statistical significance of smoking status may have resulted from our small sample size.
Our study has several limitations. First, this was a single-center, retrospective study. Second, the sample size was small. Excluding patients with systemic diseases and those with missing smoking data reduced our sample size, since our institution is a tertiary care referral center with a large population with oncologic diseases, and smoking status was generally not documented in medical records. Third, the cumulative smoking amount may be misleading since it depends on the patient’s own statement. Fourth, the study population was limited to 18-50 years of age to monitor the active thymic involution process; however, including a wider age range might yield different results. Fifth, contrast-enhanced CT may have influenced attenuation measurements. Lastly, data regarding menopause and hormonal status in female patients was not available due to the retrospective nature, which could have provided further insights into the sex-based differences of thymic involution. Similarly, information on patients’ weight and body mass index was unavailable, and the potential impact of obesity could not be evaluated.
In conclusion, this study highlights the heterogeneity of the thymic involution process, which is mainly affected by age and sex. Although cumulative smoking exposure was related to lower thymic score, smoking was not found to be an independent predictor of thymic involution. Quantitative soft tissue segmentation and density analysis demonstrated that thymic involution causes progressive functional thymic soft tissue loss due to fatty replacement rather than a true size reduction. The awareness of this variability may help clinicians and radiologists better understand the “normal” spectrum of the thymus and distinguish normal physiological involution from hyperplasia. Further prospective longitudinal studies including healthy individuals from general population are needed to better elucidate the dynamics of thymic involution.
Ethical approval
This study was approved by the Hacettepe University, Faculty of Medicine, Ethics Committee for Health Sciences Research (Date: November 25, 2025, Decision/Protocol No: 2025/22-36). Written informed consent was waived due to the retrospective nature of the study.
Data availability statement
The data supporting the findings of this study are not publicly available due to ethical and privacy restrictions, as they contain sensitive patient information and are subject to institutional regulations.
Conflict of interest
The authors declare that this study was conducted in the absence of any commercial or financial relationships that could be construed as a potential conflict of interest.
Funding
The authors declare that this study received no funding.
Generative AI statement
The authors declare that no generative AI or AI-assisted technologies were used in the writing or preparation of this study.
References
- Suster S, Rosai J. Histology of the normal thymus. Am J Surg Pathol 1990;14(3):284-303. https://doi.org/10.1097/00000478-199003000-00010
- Nishino M, Ashiku SK, Kocher ON, Thurer RL, Boiselle PM, Hatabu H. The thymus: a comprehensive review. Radiographics 2006;26(2):335-48. https://doi.org/10.1148/rg.262045213
- Araki T, Nishino M, Gao W, et al. Normal thymus in adults: appearance on CT and associations with age, sex, BMI and smoking. Eur Radiol 2016;26(1):15-24. https://doi.org/10.1007/s00330-015-3796-y
- Ackman JB, Kovacina B, Carter BW, et al. Sex difference in normal thymic appearance in adults 20-30 years of age. Radiology 2013;268(1):245-53. https://doi.org/10.1148/radiol.13121104
- Simanovsky N, Hiller N, Loubashevsky N, Rozovsky K. Normal CT characteristics of the thymus in adults. Eur J Radiol 2012;81(11):3581-6. https://doi.org/10.1016/j.ejrad.2011.12.015
- Naik S, Shri A, Sidhu S, et al. Multidetector computed tomography evaluation of normal thymus and variations with age. J Minim Access Surg 2025;21(2):101-6. https://doi.org/10.4103/jmas.jmas_25_23
- Drabkin MJ, Meyer JI, Kanth N, et al. Age-stratified patterns of thymic involution on multidetector CT. J Thorac Imaging 2018;33(6):409-16. https://doi.org/10.1097/RTI.0000000000000349
- Li L, Xu F, Han Y, Zeng J, Du S, Wang C. Thymic microenvironment’s impact on immunosenescence. Immunol Res 2024;72(5):1161-73. https://doi.org/10.1007/s12026-024-09519-z
- Liang Z, Dong X, Zhang Z, Zhang Q, Zhao Y. Age-related thymic involution: mechanisms and functional impact. Aging Cell 2022;21(8):e13671. https://doi.org/10.1111/acel.13671
- Sandstedt M, Chung RWS, Skoglund C, et al. Complete fatty degeneration of thymus associates with male sex, obesity and loss of circulating naïve CD8+ T cells in a Swedish middle-aged population. Immun Ageing 2023;20(1):45. https://doi.org/10.1186/s12979-023-00371-7
- Moore AV, Korobkin M, Olanow W, et al. Age-related changes in the thymus gland: CT-pathologic correlation. AJR Am J Roentgenol 1983;141(2):241-6. https://doi.org/10.2214/ajr.141.2.241
- Nasseri F, Eftekhari F. Clinical and radiologic review of the normal and abnormal thymus: pearls and pitfalls. Radiographics 2010;30(2):413-28. https://doi.org/10.1148/rg.302095131
- Gui J, Mustachio LM, Su DM, Craig RW. Thymus size and age-related thymic involution: early programming, sexual dimorphism, progenitors and stroma. Aging Dis 2012;3(3):280-90.
- Tibbetts TA, DeMayo F, Rich S, Conneely OM, O’Malley BW. Progesterone receptors in the thymus are required for thymic involution during pregnancy and for normal fertility. Proc Natl Acad Sci U S A 1999;96(21):12021-6. https://doi.org/10.1073/pnas.96.21.12021
- Erlandsson MC, Ohlsson C, Gustafsson JA, Carlsten H. Role of oestrogen receptors alpha and beta in immune organ development and in oestrogen-mediated effects on thymus. Immunology 2001;103(1):17-25. https://doi.org/10.1046/j.1365-2567.2001.01212.x
- Márquez EJ, Chung CH, Marches R, et al. Sexual-dimorphism in human immune system aging. Nat Commun 2020;11(1):751. https://doi.org/10.1038/s41467-020-14396-9
- Sandhar B, Vyas V, Harding D, et al. Heterogeneity of thymic output in the elderly and its association with sex and smoking. JCI Insight 2025;10(15):e189008. https://doi.org/10.1172/jci.insight.189008
Copyright and License
Copyright © 2026 The Author(s). This is an open access article distributed under the Creative Commons Attribution License (CC BY), which permits unrestricted use, distribution, and reproduction in any medium or format, provided the original work is properly cited.